Why this matters
Television and especially films play a crucial role in our modern society. The main
characters in films serve as role models and inspire the younger generation, who may
spend up to 78,000 hours watching television in their lifetime, as a survey of 2,000
British adults has shown.
Furthermore, the growing public interest in the issue of representativeness has led us
to study it through the cinema, believing that it plays a crucial role in achieving a
more inclusive society.
To do this, we use a large database of films, and construct two indicators to measure
gender and ethnic representation within a film. We then look at the evolution of the
latter over time, across the main film genres, as well as across the different countries
of the world. Finally, we will try to show how representativeness is perceived by the
general public, by analysing the reviews and the box-office revenues of films.
Research questions
We focus our analysis on two main interrogations :
- How is representativity distributed across cinematography genre, countries of production and time ?
- The theme of representativeness has become increasingly important in the public sphere in recent years, but can this trend be seen in film? Are there regional anomalies? Are there discrepancies between film genres? We will try to answer these questions. In this section we will take a descriptive approach in order to highlight the different aspects of representativeness in the cinema.
- How does representativity impact a movie’s critical and commercial success?
- Our first question looks at differences in representation within the film industry, but how are they perceived? Do they affect public opinion? Does this affect the box-office scores of the films? These are the questions we will try to answer in this second part. With an analytical approach this time, we will try to measure the impact that representativeness can have on the cinema and on the public.
Our data
Movies
Characters
Synopses
To conduct our analysis, we used the CMU Movie Summary Corpus. This is a huge dataset with information on more than 80'000 films, 450'000 characters and more than 40'000 summaries. We will guide you through the type of information available and all the manipulations we have done using the Christmas classic Love Actually as an example. The dataset is separated in three categories:
- Movies metadata
- A table with general information about the films. Moreover, it contains wikidata identifiers, which allowed us to enrich the data with an additional entry: The Rotten Tomato score. Rotten Tomatoes is an American website that gathers professional reviews of a film, then classifies them between fresh and rotten. The Tomatometer is then the freshness attributed to the film. In order to ensure that we had enough data to carry out an analysis, we also collected the number of reviews made.
| Movie | Year | Runtime | Language (VO) | Prodution country | Genre | Box office revenue | Tomatometer |
|---|---|---|---|---|---|---|---|
| Love Actually | 2003 | 136 min | English, French, Portuguese | USA, France, United Kingdom | Romantic, Drama, Comedy | 246 mio $ | 64% |
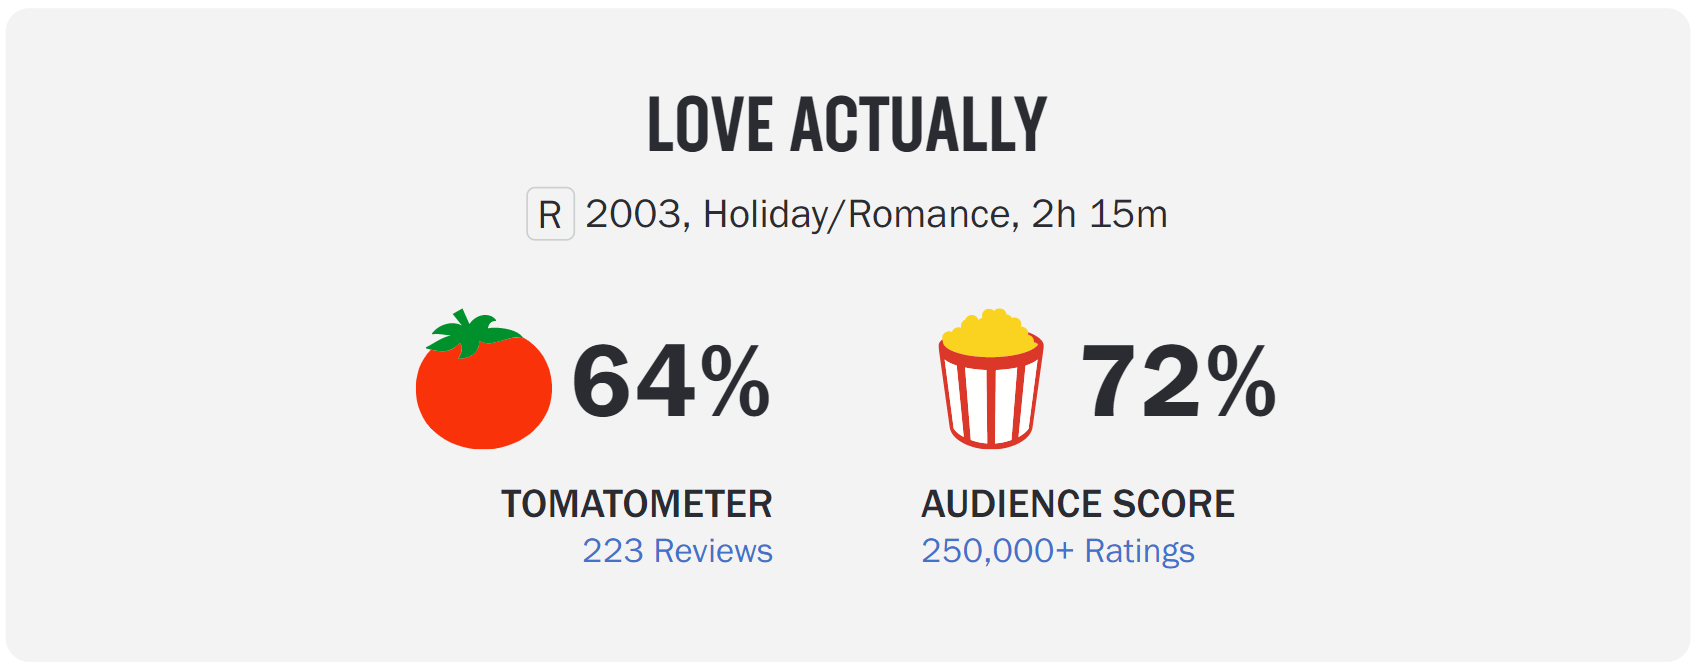
We only consider the Tomatometer score, i.e. professional reviews.
- Characters metadata
- A table with different attributes about the actors and their film characters. However, the ethnicities given for the actors were sometimes extremely specific and other times far too general. They were not usable for a meaningful analysis. We therefore grouped them into nine broad geographical categories, and a tenth to take into account unclassifiable minorities.
| Movie | Character | Actor | Age | Gender | Height | Ethnicity |
|---|---|---|---|---|---|---|
| Love Actually | David | Hugh Grant | 42 | M | 1.80m | european |
| Love Actually | Juliet | Keira Knightley | 18 | F | 1.70m | european |
| Love Actually | Karen | Emma Thompson | 44 | F | 1.71m | european |
| Love Actually | Jamie Bennett | Colin Firth | 42 | M | 1.87m | european |
| Love Actually | Karl | Rodrigo Santoro | 28 | M | 1.90m | South american |
| ... | ||||||
- Plot summaries
- English synopses from Wikipedia. In addition, in order to refine our future analyses, we analysed the lexical field used in the summaries in order to assign a masculinity and femininity score to the summary. For this purpose, we used the empath python library.
| Movie | Summary | Masculinity | Feminity |
|---|---|---|---|
| Love Actually | The film begins with a voiceover from David commenting that whenever he gets gloomy with the state of the world he thinks about the arrivals terminal at Heathrow Airport, and the pure uncomplicated love felt as friends and families welcome their arriving loved ones. David's voiceover also relates that all the messages left by the people who died on the 9/11 planes were messages of love and not hate. The film then tells the 'love stories' of many people: With the help of his longtime manager Joe , aging rock and roll legend Billy Mack records a Christmas variation of The Troggs' classic hit "Love Is All Around". Although he thinks the record is terrible, Mack promotes the release in the hope it will become the Christmas number one single. The song does go to number one; after briefly celebrating his victory at a party hosted by Sir Elton John, [...] | 0.00015 | 0.00289 |
Metrics
To answer our research questions, we first need to have a way to quantify the diversity in movies. For this purpose we created some custom metrics :
The actor score
-
The first thing we needed to measure ethnic and gender diversity was to be able to quantify the importance
of the role played by an actor. Do they play a leading role, or is it only a minor role? To do this, we
analysed the summary of the film and awarded points each time a character was mentioned, and proportionally
to the order of appearance. In addition, we used the natural language processing tool neuralcoref
based on spaCy to analyse the summaries, find the character's
co-references and replace them with their names, as highlighted in the example below.
Mathematical details
We construct the actor score as follows:
-
- Each character starts with 2 points (we will perform a logarithm and we did not want to have the case log(1) = 0).
- We then give additional points each time a character is referenced in the summary. 1 point if it is the last reference in the text, two points if it is the second last, etc.
- We calculate the actor score for each character as follows: [log(number of points)]/[total points], in order to have :
-
1. actor score ∈ [0,1]
2. ∑ actor score = 1
Original summary
On his eleventh birthday, Harry Potter discovers that he is no ordinary boy. Hagrid, a beetle-eyed giant, tells Harry that he is a wizard and has a place at Hogwarts School of Witchcraft and Wizardry, directed by the mysterious professor Dumbledore. In his first year of magical education, with his friends Hermione and Ron, Harry tackles a fully grown mountain troll, learns to play Quidditch, and participates in a thrilling "live" game of chess.Processed summary
On his eleventh birthday, Harry discovers that Harry is no ordinary boy. Hagrid, a beetle-eyed giant, tells Harry that Harry is a wizard and has a place at Hogwarts School of Witchcraft and Wizardry, directed by the mysterious professor Dumbledore. In his first year of magical education, with his friends Hermione and Ron, Harry tackles a fully grown mountain troll, learns to play Quidditch, and participates in a thrilling "live" game of chess.
| Harry | Hagrid | Dumbledore | Ron | Hermione | Snape | |
|---|---|---|---|---|---|---|
| Actor Score | 29.6% | 18.5% | 17.0% | 13.1% | 15.3% | 6.5% |
Gender metric
- The gender metric represents the parity of gender in a film. The more equitable a film is in its gender
representation, the higher its score will be. Note that we only considered the genders already present in
the dataset, i.e. male and female. We used three factors to construct this score :
- The ratio of male/female actors
- The ratio of the importance of female/male roles
- The difference in the masculinity/femininity scores of the summaries
Mathematical details
g ∈ [0,1] : the gender score asociated to a movie i
Number of male actor in movie i : mi
Number of female actress in movie i : fi
Ratio of female vs total number of actor in movie i : ri ∈ [0,1]
Cummulated importance of male actor in movie i : mpi
Cummulated importance of female actress in movie i : fpi
Ratio of cumulated importance of female actress vs total roles importance rpi
Masculinity of speech in summary of movie i : msi
Feminility of speech in summary of movie i : fsi
ri ∈ [0,1] : maximum gender diversity is at 0.5
(1 - 2 ∙ ri) ∈[-1,1] : maximum gender diversity is at 0
|(1 - 2 ∙ ri)| ∈ [0,1] : maximum gender diversity is at 0
1 - |(1 - 2 ∙ ri)| ∈ [0,1] : maximum gender diversity is at 1
This part pounder gender score by proportion of gender represented
rpi ∈ [0,1] : maximum gender diversity is at 0.5 /
(1 - 2 ∙ rpi) ∈ [-1,1] : maximum gender diversity is at 0 /
|(1 - 2 ∙ rpi)| ∈ [0,1] : maximum gender diversity is at 0 \ /
1 - |(1 - 2 ∙ rpi)| ∈ [0,1] : maximum gender diversity is at 1 /\
This part pounder gender score by relative importance of the role they play
fsi - msi : maximum diversity is at 0 /
|fsi - msi| : maximum diversity is at 0 \/
1 - |fsi - msi| : maximum diversity is at 1 /\
This part pounder gender score by the empath score of the summary
g = (1 - |(1 - 2 ∙ ri)|) ∙ (1 - |(1 - 2 ∙ rpi)|) ∙ (1 - |fsi - msi|)
| Movie | Actress | Actor | Importance of feminine roles | Importance of masculine roles | Feminity score | Masculinity score | Gender diversity score |
|---|---|---|---|---|---|---|---|
| Love Actually | 15 | 16 | 47.6% | 52.4% | 0.00015 | 0.00289 | 0.9175 |
Ethnicity metric
- This metric aims to illustrate the ethnic diversity represented in a film. To calculate this value, we take into
account three main factors
- The number of different ethnicities present in the film in ratio to the number of actors
- The relative importance of these ethnicities in terms of the number of actors (representing a minority is worth more points than representing a majority)
- The visibility of minorities in leading roles
Mathematical details
ethnicity score : s ∈ [0,1]
number of ethnicity in a movie i : ei
number of actor in a movie i : ai
ethnicity particular score : p ∈ [0,1]
ei / (min(etot, ai)) : This term account for number of ethnicity represented (linear in number) in a movie ∈ [0,1]
∑pj ∈ [0,1] : This termn account for ethnicity relative importance. The more an ethnicity is represented, the less representative value it has.
∑ (min(pj - |∑ rjki - pj|,0)) : This term account for minority visibility in main roles.
si = [ (ei / min(etot, ai)) + ∑ pj+ ∑ (max(pj - |∑ rjki - pj|,0)) ] / 3
ethnicity particluar score :
pj ∈ [0,1] , pj is the largest for ethnicity that are the least represented.
aj : number of roles/characters of a specific ethnicity (in the whole dataset)
rjk : Importance of the role k
pj = [1/ln(aj)] / [∑ 1/ln(al)] ≡ pj = 1 / [ ln(aj) ∙ ∑ (1 / ln(al) ) ]
Thus we have : pj ∈ [0,1] and ∑ pj = 1
Importance of actor role :
rki : Importance of the role k in the movie i
∑rjki : Cumulated importance of the roles played by acotors of ethnicity j in the movie i
∑ rjki - pj : Maximum ponderation for specific ethnicity at 0 /
|∑ rjki - pj| : Maximum ponderation for specific ethnicity at 0 \ /
pj - |∑ rjki - pj| : Maximum ponderation for specific ethnicity at pj / \
max(pj - |∑ rjki - pj|,0) : Maximum ponderation for specific ethnicity at pj / \
| Movie | number of ethnicity represented | Importance of ethnicity represented | Ethnicity diversity score |
|---|---|---|---|
| Love Actually | 40% | 33.6% | 0.2808 |
How is representativity distributed across cinematography genre, countries of production and time?
Release date's influence
We are first interested at how the scores evolved through time. The average values of the gender diversity metric and ethnicity
diversity metric are displayed in the graph below.
Two trends can be seen to emerge. On the one hand, ethnic diversity
seems to be decreasing slightly or maybe even stabilising over the years, while on the other hand, we can clearly see
the diversity of the genre increasing, having almost tripled in less than a century.
An attempt can be made to explain
some of the decline in ethnic diversity by the growth of Indian cinema with the rise of Bollywood in particular and the
resulting large increase in actors of South Asian ethnicity. This cinema is naturally at a disadvantage in terms of
ethnic representation because it has only one predominant ethnicity, unlike American cinema, which can have two: North
American and African-American. In addition, Indian cinema has a large number of actors, thus it does not represent a
minority and therefore makes especially few points.
On the contrary, we did not find an obvious explanation for the increase in gender diversity, so this would rather
suggest a societal change, which is good news for the representation of diversity. Later we shall try to measure
if this effect is visible in commercial or critical success of a movie.
To visualise the evolution of the different genres of films produced, the ethnicity of the actors involved and the main countries
of production over time, we have created the interactive graph below. By double clicking on the title of a data item, it is
possible to select it in order to better visualise its evolution over time. Also it is normalised to see the percentage
distribution of our data.
This graph represents the evolution of world cinema, with all the biases associated with the method and
completeness with which the CMU Movie Summary Corpus data was collected. The
emergence of Bollywood cinema, and the associated growth in the number of South Asian actors, can easlily be observed, as well as
the decline of black and white films. Interestingly enough, one can see the golden age of Italian cinema in the mid sixties where at
its peak it represented 25% of the world film production.
Country of origin's influence
We were then interested to see if some country typically produced more diverse movies. The plot below shows
for each country (when available) the average scores of movies produced by said nation. The dropdown menu allows
to select between gender diversity score and ethnicity diversity score.
Regarding ethnic diversity, there are no big surprises or particularly interesting discrepancies. Countries
(or rather continents) with a minor film industry naturally produce fewer actors, and therefore represent minorities
on screen. Hence, they naturally obtain better results. The case of India is a small exception, with a particularly
low score.
Similarly, there is no particular discrepancy regarding the representativeness of the genre with the exception of
the Iran-Pakistan-India area. An area that is not usually known for its gender equality, it is therefore particularly
surprising that it scores so well in terms of gender representation, almost 25% higher than the US.
Note however that we only measure the importance of gender on screen in terms of visibility, and do not do further analysis
on potential stereotypes that may exist.
Movie genre's impact
Finally, we looked at the distribution of the two scores among the main film genres. In order to have
a meaningful comparison, we considered only the 12 most common types of films in the dataset.
Firstly, we notice that the category with the highest genre diversity scores is romance films. This
is easily explained as most films in this genre have a male and a female lead. Then, unsurprisingly, one
of the worst scores is for the category of black and white films. This is a category of film that has
disappeared over time, while the average representation of the genre has increased. On the other hand,
it is more worrying that action films, short films and documentaries are the worst performers. When the
number of actors is low or when there are heroes, it is regrettable to see that it is always men who are highlighted.
Regarding ethnic diversity, the metric is relatively well distributed across genres, with some interesting points.
On the one hand, it is curious to see that black and white films, which had a very poor representation of the
genre, are exemplary this time. Equally curious, but regrettable this time, is that the World Cinema category
has the worst score, without us being able to provide a convincing explanation.
How does representativity impact a movie’s critical and commercial success?
In order to do the following analysis, we will use two additional features : the Rotten Tomatoes scores and the box office revenue.
The Rotten Tomatoes scores represent the success of the movies among critics. Whereas, the box office revenue represents the commercial success.
We will conduct an observational study to understand if the representativity in movies influences their success.
The goal of the observational study is to eliminate all the elements that could influence the success of movies except the one we're interseted in :
representativity of course. These parasitic elements are called cofounders and the method to remove them is called matching.
In our case, we will remove the following cofounders: the country of production of a movie, the year of the production and the genre of the movie.
Once the cofounders are eliminated, we will finally be able to know if diversity in movies influence their success.
The effect of representativity
In this first part, we'll use exact matching : a movie with low diversity and a movie with high diversity are matched if they have exactly the same genre,
country of production and year of production, in order to make an unbiased comparison.
The left-side graph shows the impact of diversity on the Rotten Tomatoes score, which represents the film's critical reviews. It can be seen that on average
films with greater diversity are more successful, with for example an average of 4 points more on reviews of films with high ethnic diversity. However, it
is important to note that this effect is not statistically significant, as the uncertainties are far too great.
The right-hand chart illustrates the impact of diversity on box-office revenues. This time the trend is clearer and the uncertainties lower. There is even
a statistically significant difference for the impact of gender diversity, suggesting that film with higher gender diversity are indeed more successful,
at least in term of commercial success.
You can hover over the plot to see if you find your favorite movie!
Time evolution of the effet of representativity
We now want to analyze if the influence of representativity in the success of movies evolves with time. In order to do so, we need to consider
movies year by year. Therefore, we manipulate less data at once. As we can not afford to loose much data points, we will use propensity score
matching. It is a more complex but less strict method than exact matching.
The graph below shows the evolution of the difference in Rotten Tomatoes score between films with high diversity versus films with low
diversity. The scale is directly the number of additional percent obtained by movies with higher diversity.
One can observe that there is no clear trend of a potential effect of ethnic or gender diversity on the film reviews given by the Rotten Tomatoes score.
We see fluctuations from year to year, linked to the limited number of films available, while the average seems to remain stable
around zero.
We can see that the effect on ethnic diversity this time is slightly below zero, which contrasts with our previous
results. We explain this slight difference by the method of matching (propensity and no longer exact) which has changed. In any
case, the effect is not statistically significant enough for us to conclude that the effect is indeed present.
The graph below represents the difference in the average log revenue of high diversity films compared to low diversity films. For example, a difference
of 0.3 means that films with high diversity, on average, earned about 3 million dollars more in revenue.
Despite the annual differences, it can be seen that there is no significant change in the effects over the twenty years considered. On the other hand,
although there is no trend, we observe that the average is systematically higher than zero, which supports our previous analysis suggesting the presence
of a diversity effect on the commercial success of a film.
Conclusion
Through this project, we explored the influence of gender and ethnic diversity in the movie industry. To this end, we built two metrics: the gender diversity metric and the ethnicity diversity metric. We then answered two broad research questions:
- How is representativity distributed across cinematography genre, countries of production and time ?
- The most interesting result we obtained when answering this question is the time evolution of the representativity. Indeed, in the last 50 years, the average gender representativity has been multiplied by 3 ! It was an interesting yet pleasing discovery, even though the way to equity is still long. On the other hand, the ethnicity score has slightly reduced over the same time window.
- How does representativity impact a movie’s critical and commercial success?
- All our results were in the encouraging direction of a more diverse and equitable cinema, although the only statistically significant result we obtained is the impact of gender diversity on box office revenue.
These two results combined give us some very interesting insights.
As we said, the success of movies is more impacted by gender diversity than it is by ethnicity diversity. We also observed that only the gender score increases over time.
This is good news for gender diversity! There is still plenty of work to be done because we're still far from the objective, but we are going in the right direction.
On the contrary, our results show that the problem of the lack of ethnicity diversity is not yet ready to be solved in the cinema industry.